APB has made the CBIG Management P&L available in Cognos (called Sources & Uses), providing enhanced functionality that allows users to drill through directly to the underlying general ledger transaction details. We hope this report becomes a valuable resource for understanding financial performance, exploring trends, and gaining insight into how individual activities roll up into the management reporting structure.
The Sources & Uses Report provides a summary of the resources available to a department, organization, or fund and how those resources were used. The report shows beginning available resources, current-year funding received, expenditures incurred, and the remaining balance available for future activities. It is intended to help campus users understand where their funding came from, how it was spent, and the overall financial position of their unit.
This report was built using Cognos. For additional tips and tricks on using Cognos see the tips and tricks page here.
Access
Access has been provisioned to any user who has CDW QDB access.
Prompt Page
Upon opening the report, you'll see the prompt page where you'll be able to filter your report. After running the report, you are able to go back to the prompt page if needed.
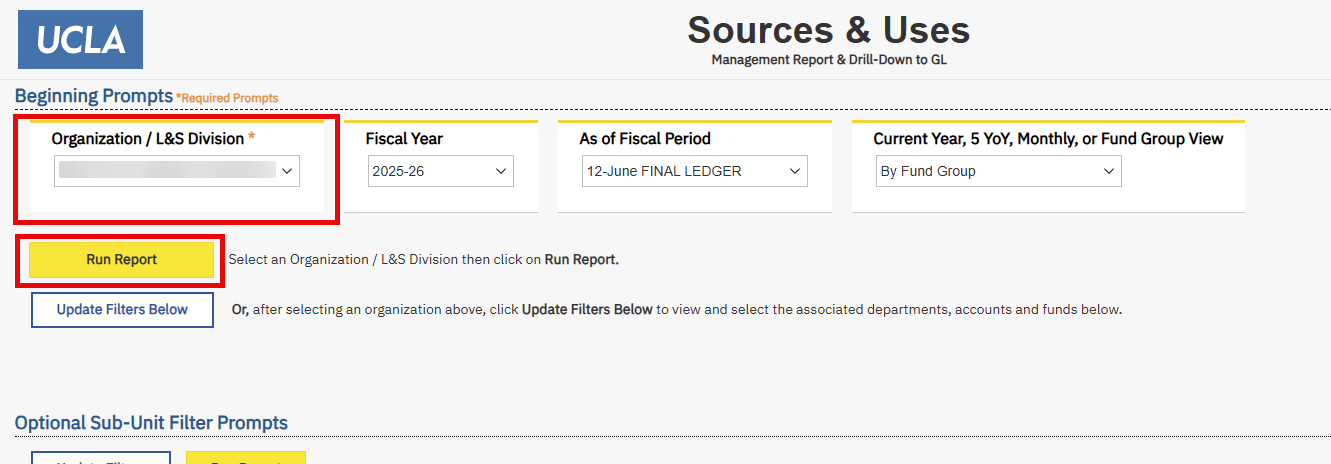
Use these parameters to filter for the data you want to view.
- Organization / L&S Division is the only required prompt
- Fiscal Year and Accounting Period are automatically selected, but you can change this if you'd like to see a different period
- Click on Run Report to run the report or after selecting your organization, update the available filters below
Optional Prompts
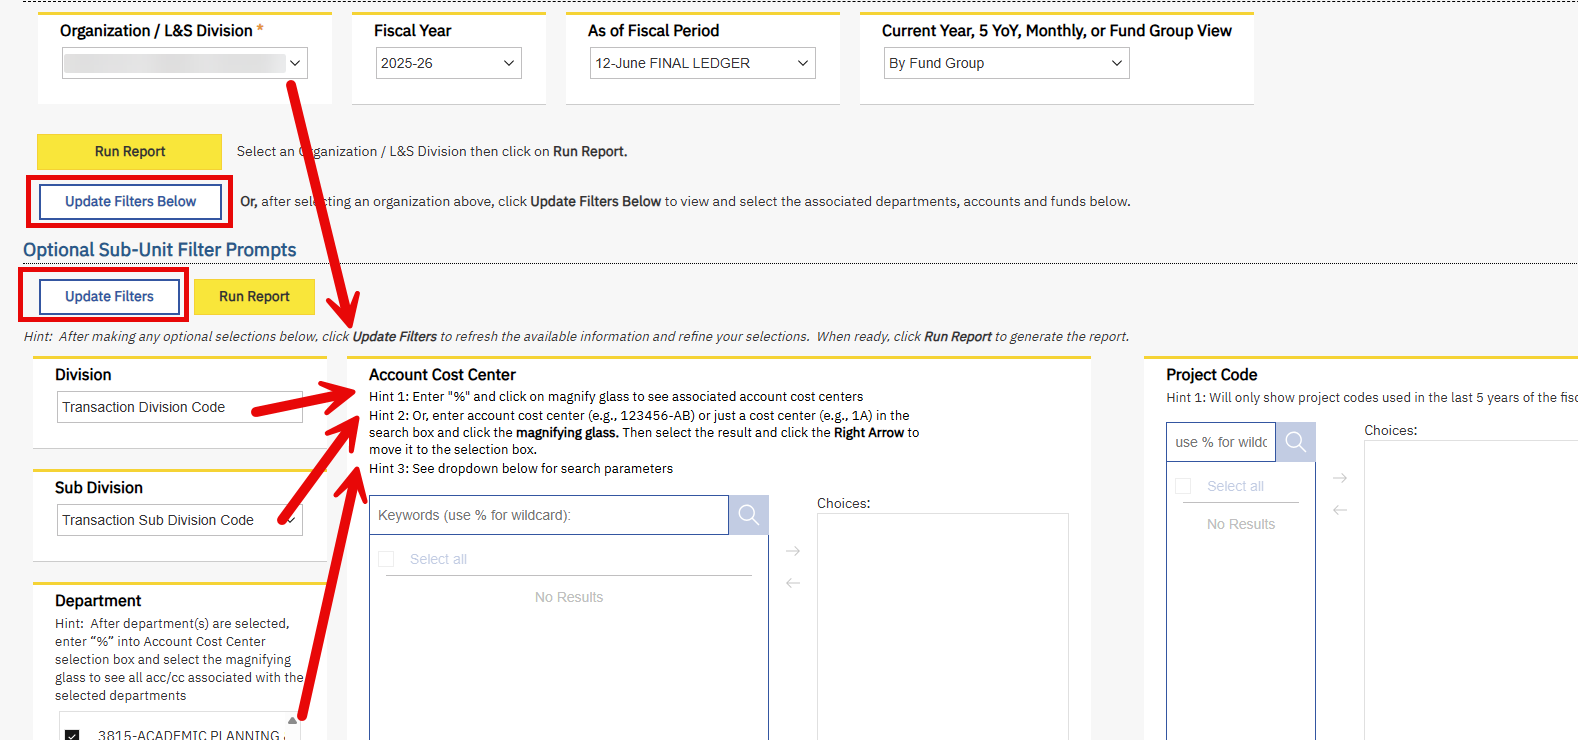
- Division, Sub Division, Department, Account Cost Center, and Project Code are filtered by the Organization selection at the top of the prompt page.
- As you filter Division, Sub Division, or Department, if you would like to narrow the available account cost centers or project codes to filter on, be sure to click on the Update Filters button.
Search and Select Prompts
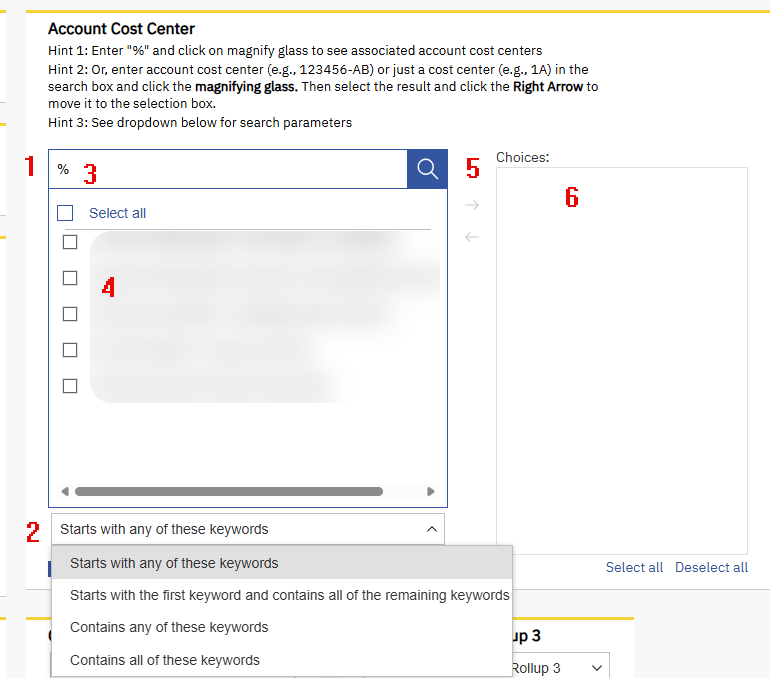
The Search and Select prompt allows you to quickly find and select one or more values from a large list of available options to filter the report.
- Enter a keyword in the Search field to find the value you need.
- At the bottom of the keyword search, choose how Cognos should match your search:
- Starts with any of these keywords – finds values that begin with your keyword.
- Contains any of these keywords – finds values that contain your keyword anywhere in the value. This is the preferred option because it provides a broader, more flexible search.
- Use % to see all values – entering only the % sign as your search term will return all available values.
- Select the desired value(s) from the search results.
- Move your selection to the Choices box – highlighting a search result alone does not select it for the report. You must use the arrow/select control to move the value into the Choices box.
- Verify the Choices box before continuing – only the values moved into Choices will be used to filter the report.
Current Year, 5 Year, Monthly, and by Fund Group Views
The report allows you to toggle between 4 different views. You may change the view from the prompt page, or after running the report:
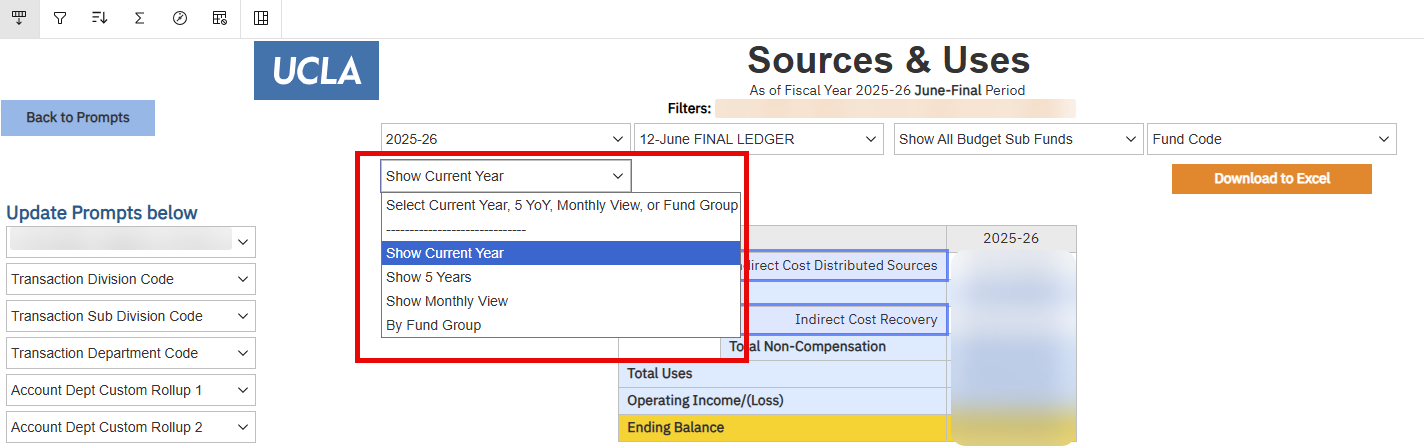
- Current Year (this is the default view)
-Shows just one column for the Fiscal Year selected - Show 5 Years
-Shows the last 4 years including the Fiscal Year selected - Show Monthly View
-Shows a monthly breakdown of the current year selected
-June includes all fiscal year end periods (Prelim, Interim, Final). - By Fund Group
-Shows the Budget Sub Fund Groups as columns
Report Output
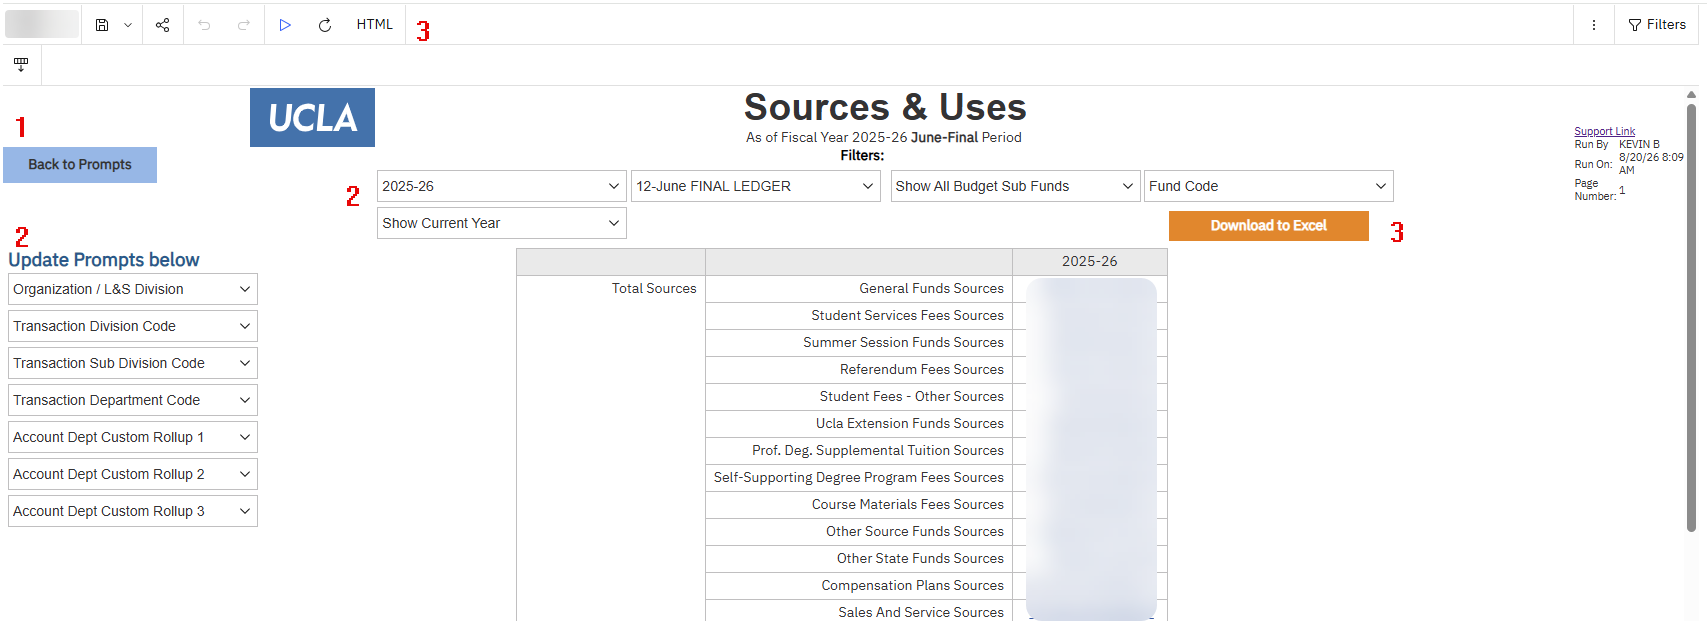
- Click on the Back to Prompts button at the top left to go back to the prompt page to adjust your filters
- The report output will have additional filters at the top and on the left to quickly change the report on the page
- You can download to excel by either clicking on the Download to Excel button or by selecting "HTML" and changing the view at the top left of the screen
Mapping and how it relates to the General Ledger
Link to the guide on how the General Ledger is used to create this report.
Custom Account Cost Center Groupings
Custom Account Center Groupings can be created by assigning account cost centers up to 3 attributes
Frequently Asked Questions
- How often is this report updated?
- Data should be updated daily from the financial system
Release Notes & Communications
8/19/26 -Released to pilot testing workgroup